Case Report 
![]() Creative Commons, CC-BY
Creative Commons, CC-BY
An Optimization Power Calculation Approach for Precision Medicine Clinical Trials
*Corresponding author: Peijin Wang, Department of Biostatistics and Bioinformatics, Duke University School of Medicine, Durham, North Carolina, USA.
Received: August 22, 2022; Published: September 16, 2022
DOI: 10.34297/AJBSR.2022.17.002313
Abstract
In clinical trials, the conventional power calculation approach for determining the required sample size cannot control the inter-subject variability. Consequently, it may underestimate the treatment effect and/or overestimate the population variance for a specific subpopulation such as the enriched population in precision medicine clinical trials. In this article, we propose an optimization power calculation approach for computing the required sample size for precision medicine clinical trials by controlling variability and maintaining the desired treatment at the same time. The proposed power calculation approach cannot only provide a smaller and more precise sample size for achieving the primary objective of the intended trial but also have a sketched idea regarding how many subjects will be accrued for achieving the secondary objectives.
Keywords: Controlling Variability; Maintaining Treatment Effect; Optimization Power Calculation; Precision Medicine
Introduction
Precision medicine is an innovative model tailoring the target population of the treatment/drug by considering patient characteristics, such as genetic makeup, health status, environment, and lifestyles, which aims to maximize the quality of healthcare for individual patients [1-3]. Due to the complexity of customizing healthcare or treatment, precision medicine is a highly sophisticated process rather than simply stratifying the target population into several subgroups. Koenig et al. [4] have divided the precision medicine model into three tracks: preprocessing data, validating diagnostic and prognostic models, and developing and validating specific models to conduct analysis. Nowadays, precision medicine has been widely used in different clinical specialty areas, including oncology, respiratory diseases, and cardiovascular diseases [5-7]
In the complex process of precision medicine, one important phase is to identify the subpopulation who may have more benefit from using the test treatment. One commonly used tool in this identification phase is the biomarker, which is usually a shortterm indicative endpoint for the long-term primary outcome [1] In precision medicine, researchers tend to be more interested in the performance of the treatment under investigation for a specific subpopulation, which makes the conventional randomized clinical trials (RCTs) not work well. In other words, traditional RCTs only assess the average treatment effect in the overall population, whereas precision medicine trials tend to be more interested in a specific subpopulation.
Some biomarker-drive RCT designs have been proposed for precision medicine trials. Three major types of biomarker-RCT designs are biomarker-stratified designs, enrichment designs, and biomarker-strategy designs [8]. Biomarker-stratified designs are commonly used when researchers have limited evidence about which subpopulation may prefer the test treatment; enrichment designs can be used when we have sufficient evidence to determine subpopulation which has more benefit; and biomarker-strategy designs are less favorable since it is statistically problematic [8]. Additionally, some advanced clinical trial designs or design selection criteria for precision medicine have been proposed. Kappelmann et al. [9]proposed the nested-precision RCT (npRCT) to combine traditional RCT with precision RCT with precision RCT. Takazawa and Morita [10] provided optimal decision criteria. provided optimal decision criteria to select the optimal study design for phase III biomarker-drive trials by optimizing the expected net present value and the probability of success.
In typical RCTs, the power analysis for sample size calculation contains four steps: (i) formulate the hypotheses, (ii) derive the test statistic under the null hypothesis, (iii) evaluate power function under the alternative hypothesis, and (iv) for a fixed significance level and desired power level, compute the required sample size. For precision medicine, this typical approach based on power analysis may not be feasible since precision medicine tends to additionally focus on minimizing inter-subject variability [1]. In other words, the conventional approach is less applicable since it cannot control the inter-subject variability. The domain knowledge used for power calculation may underestimate the treatment effect or overestimate the population variance for a specific subpopulation such as an enriched subpopulation for development of precision medicine.
In this article, our goal is to propose an optimization power calculation approach for precision medicine clinical trials by controlling the intra-subject variability and maintaining desired treatment effect at the same time. In the next section, the power calculation process in enrichment design is illustrated. The proposed optimization approach and its comparison with the typical power calculation approach are discussed in Section 3. Section 4 provides some concluding remarks.
Power Calculation
As mentioned earlier, biomarker-strategy designs are statistically problematic since a certain proportion of the study population (a proportion of the biomarker-directed arm and the control arm) will receive the same treatment [8]. In this way, we would underestimate the treatment effect, and the statistical power would decrease. Freidlin et al. have also also proved that the biomarker-stratified design requires a higher cost and longer follow-up period. Thus, instead of using one specific typical type of trial, many scholars chose to combine some of the strategies with other techniques to generate innovative clinical trial designs, such as enriched biomarker stratified designs and auxiliary-variableenriched biomarker stratified designs [11].
For illustration purposes, this paper will focus on the enrichment design and assume that there is enough evidence suggesting that the treatment may have greater benefit in biomarker-positive patients. The enrichment designs considered in this section are the simplest scenario, as shown in Figure 1. In design (A), both randomization and statistical analysis will be applied to biomarkerpositive subjects, and the study object is to investigate the performance of the test treatment on biomarker-positive patients only. In design (B), researchers tend to set the primary object the same as design (A), however, the secondary objective is to test the drug performance on the overall population [12].

Figure 1:Enrichment design. Design (A) conducts randomization and analysis on biomarker-positive patients only; whereas, in design (B), study population will be divided into biomarker-positive and biomarker-negative subpopulation, and randomization will be applied to both biomarker-positive and biomarker-negative patients. In design (B), the primary objective is for the biomarker-positive population.
Let YT denote the response of patients assigned to the treatment group and YC denote the response of patients assigned to the control group. Let X1T and X0T denote biomarker-positive and biomarkernegative patients in treatment group, and X1C and X0C denote biomarker-positive and biomarker-negative in control group. Assume the responses of both group follows normal distribution. Let W denote the biomarker indicator, and , where p may be obtained from previous literature. Then, we have YT=X1T and YC=X1C in design (A), and YT =WX1T + (1−W) X0T and YC =WX1C+(1-w)X0C in design (B).
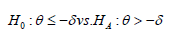
In design (A), assume the primary object is to test for efficacy on biomarker-positive patients using a non-inferiority test. Let δ be the non-inferiority margin, θ be the treatment difference, and σ21 be the population variance (assume the variances are the same for treatment and control groups). The hypotheses are
Using two-sample z test, the sample size of the treatment group can be written as

where zq is the q% quantile of standard normal distribution, the allocation ratio is k:1. The sample size of the control group is nC=knT.
Assume the primary object for design (B) is the same as the one for design (A). The power calculation should be derived based on the testing efficacy for biomarker-positive patients. However, the number of biomarker negative patients should also be considered since the secondary objective is to evaluate the treatment performance in the overall population. Using the reduced optimal enrichment ratio generated by Yang et al., (2015) [12], the treatment and control arm sample sizes for biomarker negative patients are
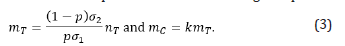
Thus, the total sample size of treatment and control arms in design (B) are nT+mT and nC+mC.
A Proposed Optimization Power Calculation Approach
From the power calculation in Equation (2) and (3), the sample size of each arm can be written as a function: for design (A) and for design (B). Different from traditional power calculation process, precision medicine may have some extra constrains on the biomarker-positive patients’ treatment difference θ and variance . Typically, the domain knowledge, i.e., expected treatment difference and population variance, obtained from previous literature used to conduct power calculation may from studies powered on overall population efficacy. It is possible that the treatment difference is underestimated, and the variance is overestimated. In other words, we may believe that in precision medicine, the biomarker-positive patient population may have smaller variance and better efficacy. Thus, we may treat power calculation as an optimization problem.
Use design (B) as an example, the objective function and constrains of the optimization problem are

where nT + mT can be obtained by Equation (2) and (3), θ0 and σ02 are the expected treatment difference and population variance,λ1 and λ2are the factors used to constrain true treatment effect and variance λ1 ,λ2 > 0. θ0 ≤θ represents that the precision medicine is expected to have better efficacy.σ21≤σ02 and σ21 ≤ σ22 represent that the precision medicine has a better control on intrasubject variability. From Equation (2), we know that σ1 2 is in thenumerator, and θ is in the denominator. Theoretically, without using the constrain factors, σ1 2 may take an extremely small value, or θ may take an extremely large value to minimize the objective function. In either case, the sample size of each arm may go close to zero. In practice, though precision medicine can help increase the benefit and control population variance, it is unlikely that precision medicine will make extreme differences. In other words, it is reasonable to provide a limit for the benefit of limiting the treatment to biomarker-positive patients.
Next, we evaluate the proposed optimization approach by comparing it with the typical approach in terms of the sample size of biomarker-positive treatment arm. Assume the significance level is two-sided α=0.05, desired statistical power is 1-β=80%, the allocation ratio is 1:1, and the prevalence of biomarker-positive in the target population is p=0.10. Let the non-inferiority margin (δ ) be 0.1, 0.2 and 0.3, the treatment difference from previous literature ( θ0) be 0.2, 0.4 and 0.6, the population variance from previous literature ( σ02 ) be 1, 2 and 3. The sample sizes computed using traditional approach and the proposed optimization approach are shown in Table 1.
From the computation results, solutions to the optimization problem shown in Equation (4) are greatly affected by the constrain ratios on treatment difference and variance, i.e., λ1 and λ2 . Specifically, the optimal solutions are on the boundaries of the constrain functions. If the upper bound of θ tends to be higher, θ * tends to be larger, and the sample size using the optimization approach tends to be smaller; if the lower bound of σ1 2 tends to be higher, σ*1 tends to be larger, and the sample size using the optimization approach tends to be larger.
As shown in Table 1, we find that the typical approach of power calculation always provides a larger sample size compared with the optimization approach. Since one benefit of using precision medicine is to control the within-group variance. Using the typical power calculation approach, we may collect more patients than we truly need. By using the optimization approach, researchers will be able to alleviate the sample size requirement for the primary objective and have a sketched idea about how many patients will be accrued for the secondary objective (evaluating treatment performance on overall patients). And the sample size difference between using typical approach and optimization approach will be larger if σ02 increases or θ0 decreases.

Table 1. Sample size comparison.
Note: The parameter settings are α=0.05, 1-β=80%, k=1, p=0.10. θ*, σ12* and σ22* are the solution to the optimization problem shown in Equation (4).
Additionally, σ12∗ and σ22* are the same in all settings. Though ideally the variances of biomarker-positive and negative patients may be different, a smaller σ22 will lead to a smaller sample size. To make the optimal function closer to reality, we may choose to give biomarker-positive and negative treatment group sample sizes different factors, i.e., the objective function could be
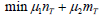
If μ1 > μ2 , it suggests that we have a higher requirement on minimizing the sample size for biomarker-positive patients; otherwise, we have a higher requirement on minimizing the biomarker negative patient sample size. Since the selection of μ1 and μ2 relies heavily on the specific information about the trial, the numerical analysis using Equation (5) will be considered.
Concluding Remarks
With the great enhancement of genome sequencing techniques, diagnostic sensitivity and precise therapeutic targeting, precision medicine has become a very hot topic, which aims to evaluate the performance of the test treatment or drug on a specific subpopulation. In precision medicine, conventional two-arm parallel design becomes less favorable, some new designs, such as biomarker-stratified design, enrichment design, and other adaptive designs have been proposed to investigate the performance of precision medicine. Different from typical medicine, precision medicine tends to increase the treatment efficacy and control the inter-subject variability at the same time. Thus, the typical power analysis for the sample size calculation approach may be not feasible since in precision medicine, the domain knowledge used to conduct power calculation tends to be the treatment effect is larger than a threshold and the population variance is smaller than a threshold. Therefore, it is possible to treat power calculation for precision medicine clinical trials as an optimization problem.
Using the proposed optimization approach, the sample size can be obtained while controlling the treatment difference as well as the population variances. In the numerical analysis, we consider the enrichment design (B) shown in Figure 1, where the primary objective is to test for efficacy in biomarker-positive patients, and the secondary objective is to test for efficacy in overall patients. Because the information about the precision medicine used in power calculation is more precise, the proposed optimization approach tends to give a smaller required sample size compared with the typical power calculation approach. The difference in sample sizes computed using these two approaches tends to be greater when the treatment difference decreases or the population increases. We also find that the solutions to the optimization problem are always on the boundaries, suggesting that the selection of the constrain factors in Equation (4) is essential. Additionally, the influence of the constrain factors on the value of the objective function is not great.
By using the proposed optimization approach to conduct power calculation, researchers will be able to obtain a smaller and more precise sample size to conduct statistical analysis for precision medicine clinical trials. And they could also have a sketched idea about how many patients will be accrued for the secondary objective. The objective function we used is the sample size for treatment group patients, i.e., the sum of biomarker-positive and biomarker-negative sample sizes. In practice, researchers may have different priorities on sample sizes for primary and secondary objectives. Specifically, researchers may have a greater desire on minimizing the sample size for the primary objective. In this way, the optimal objective function will be the one shown in Equation (5). Since it may require more domain knowledge and beyond the scope of this paper, we have not discussed it in detail. The ultimate goal of this paper is to propose an innovative power calculation approach for precision medicine using the optimization approach, which may make better use of the information we have on the test treatment aiming to precisely compute the required sample size.
References
- Chow S (2019) Innovative Statistics in Regulatory Science. Chapman and Hall/CRC.
- Kosorok MR, Laber EB (2019) Precision medicine. Annual review of statistics and its application 6: 263.
- National Research Council (2011) Toward precision medicine: building a knowledge network for biomedical research and a new taxonomy of disease.
- Koenig IR, Fuchs O, Hansen G, von Mutius E, Kopp MV (2017) What is precision medicine? European respiratory journal 50(4).
- Liu Y, Du J (2017) Precision Medicine in Cardiovascular Diseases. Cardiovascular Innovations and Applications 2(2): 155-161.
- Williams JR, Lorenzo D, Salerno J, Yeh VM, Mitrani VB, et al. (2019). Current applications of precision medicine: a bibliometric analysis. Personalized medicine 16(4): 351-359.
- Zhang W, Wang J, Menon S (2018) Advancing cancer drug development through precision medicine and innovative designs. Journal of biopharmaceutical statistics 28(2): 229-244.
- Freidlin B, McShane LM, Korn EL (2010) Randomized clinical trials with biomarkers: design issues. Journal of the National Cancer Institute 102(3): 152-160.
- Kappelmann N, Müller-Myhsok B, Kopf-Beck J (2021) Adapting the randomised controlled trial (RCT) for precision medicine: introducing the nested-precision RCT (npRCT). Trials 22(1): 1-5.
- Takazawa A, Morita S (2020) Optimal decision criteria for the study design and sample size of a biomarker-driven phase III trial. Therapeutic Innovation & Regulatory Science 54(5): 1018-1034.
- Wang X, Zhou J, Wang T, George SL (2018) On enrichment strategies for biomarker stratified clinical trials. Journal of biopharmaceutical statistics 28(2): 292-308.
- Yang B, Zhou Y, Zhang L, Cui L (2015) Enrichment design with patient population augmentation. Contemporary clinical trials, 42: 60-67.


 We use cookies to ensure you get the best experience on our website.